
Sales forecasts shape some of the biggest calls a revenue team makes – hiring plans, territory coverage, spend, board expectations.
A single number carries a lot of weight.
What’s harder is keeping that number grounded as deals move, buyers hesitate, and plans change mid-quarter.
We’ll break down how modern teams build sales forecasts, which sales forecasting methods hold up in practice, and how to turn forecasting into a reliable planning discipline.
Key Notes
- Forecast accuracy depends on enforced stage criteria, clean CRM fields, and consistent pipeline hygiene.
- Reliable forecasts require segment-level historical data, explicit assumptions, and regular recalibration.
- Strong teams use layered sales forecasting methods, not a single model or gut judgment.
Foundations you must get right first
Every sales forecasting methodology depends on the same thing: the inputs.
If the inputs are messy, your output will be messy.
Even if it is “AI.”
Align the sales process & enforce stage discipline
Start by mapping your buyer journey and mirroring it in CRM stages. Then do the hard part.
Define entry and exit criteria for every stage.
Example:
- Discovery stage exit criteria: business problem confirmed, stakeholder map started, next step scheduled with date.
- Proposal stage exit criteria: pricing shared, decision process confirmed, mutual action plan agreed.
These criteria are not a training deck. They are rules.
If a deal does not meet the criteria, it cannot move forward.
Train the team on what “counts”
Most stage discipline fails because reps were never coached on how to use it under real pressure.
Set expectations:
- Stage movement requires evidence.
- Close dates are not placeholders.
- Every deal has a next step scheduled.
Then reinforce it in weekly reviews. That is where the culture forms.
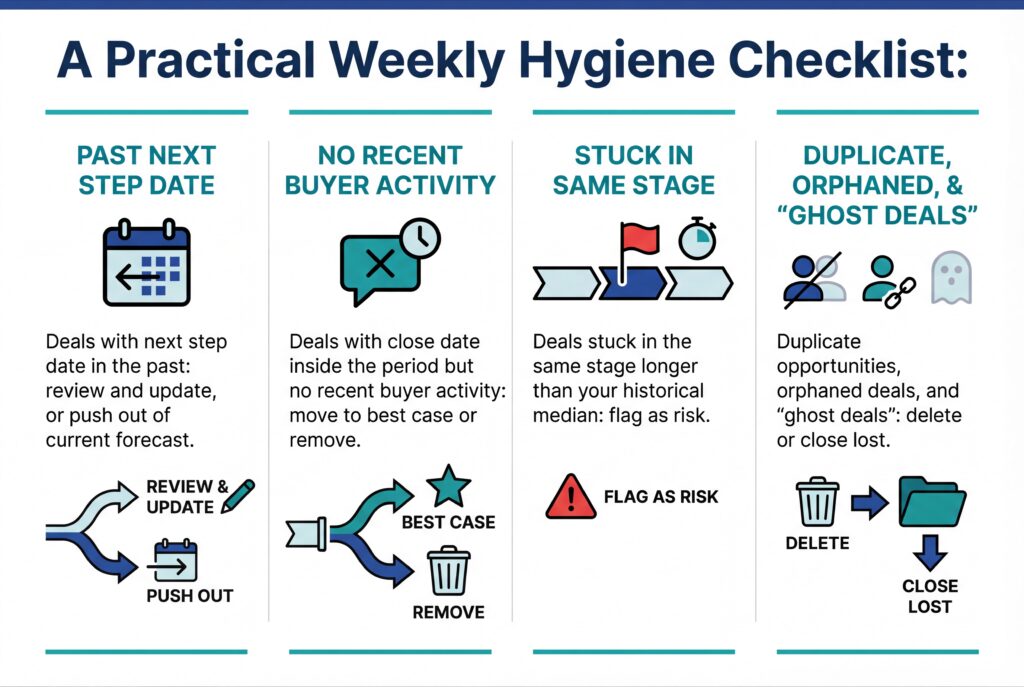
Fix CRM hygiene before you trust any forecast
Forecasting accuracy starts with three fields. If these are wrong, everything is wrong.
- Next Step or Activity Date: If it is in the past, the deal is stalled. Treat it as risk.
- Close Date: If it has been bumped multiple times, treat it as risk.
- Stage: If it is not backed by criteria, treat it as risk.
Other fields matter too, but these are the non-negotiables.
One warning worth repeating:
Fragmented data is one of the biggest sources of inaccurate forecasts. If marketing and sales definitions are misaligned, you will double-count the world.
Define forecast horizon & granularity
Your forecast period should match your sales motion.
- Short-cycle motions often need monthly or even weekly granularity.
- Most B2B orgs anchor forecasting to quarters because budgets and board reporting follow quarters.
- For strategic planning, a rolling 12 to 18 month forecast updated quarterly is usually more useful than a static annual plan.
Granularity matters too. Forecasting should start at the lowest level you can trust.
- Opportunity-level and rep-level rollups are typically more accurate.
- Top-down targets are useful as a sanity check. They are dangerous as the forecast.
The data you need (& how much of it)
Forecasting is just applied learning. The model learns from history, then predicts the near future.
Collect the internal inputs that move the number
At minimum, you need:
- Win rates by stage
- Average deal size by segment
- Sales cycle length by segment and stage
- Pipeline volume and stage distribution
- Renewal rates, churn, and expansion rates if you sell recurring revenue
Do not treat these as company-wide averages if you have meaningful segmentation.
Enterprise does not behave like mid-market. New logo does not behave like expansion. Different segments have different cycle times and different truth.
How much history is “enough”
A practical rule:
Collect at least 2.5 times your average sales cycle worth of data.
If your cycle is 3 months, you want roughly 8 to 9 months of pipeline history.
If your cycle is 8 months, you want closer to 20 months.
This is not a purity test. It is about statistical confidence.
Layer in external context without making it fluffy
External factors matter when they change conversion rates, deal sizes, or timing.
- Seasonality in buyer budgets
- Competitive moves that change win rates
- Regulatory shifts
- Macro signals like interest rates if your buyers are sensitive to cost of capital
Example:
- “We expect procurement cycles to extend by 15% this quarter due to budget freezes.”
- “We are lowering stage 4 conversion by 5 points in the healthcare segment due to a new competitor.”
Forecasts improve when assumptions are explicit.
How to build a sales forecast step by step
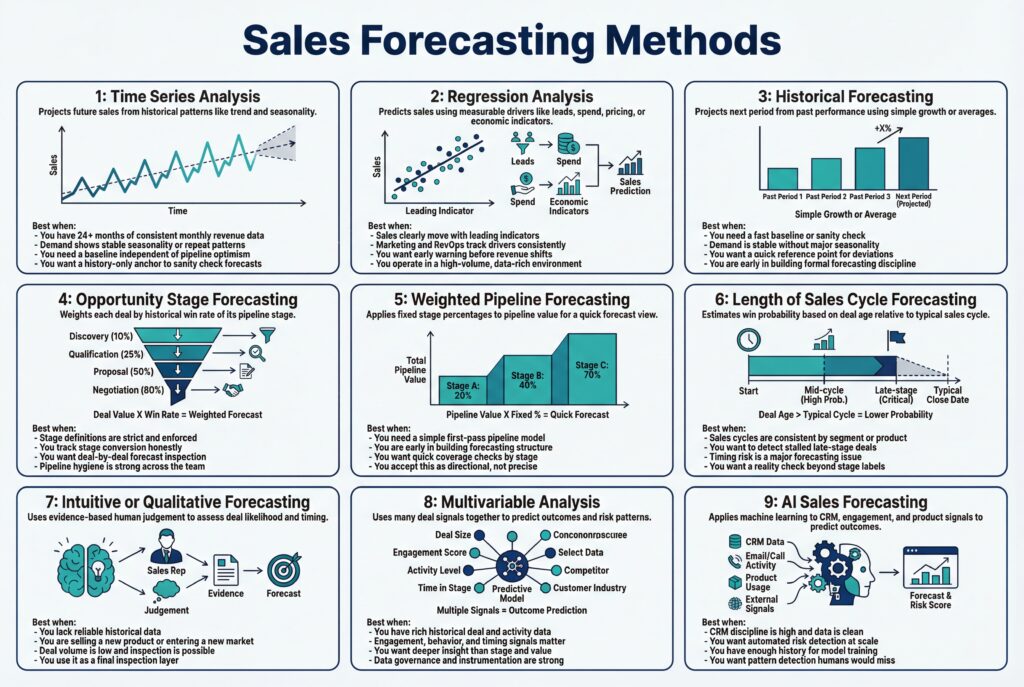
Step 1: Choose your forecasting methodology
The best way to forecast sales is rarely a single method. It is a method stack.
There are many sales forecasting methods, but a practical starting point for many B2B orgs:
- Weighted pipeline using your own historical win rates by stage
- Commit and best case buckets for managerial judgment
- Trend overlays for seasonality and known shifts
Document your definitions and assumptions:
- What qualifies as commit
- What qualifies as best case
- How probabilities are assigned and updated
- What renewals and churn assumptions are included
Step 2: Build the model from measurable inputs
Most forecasting models are variations of the same ingredients:
- Pipeline value
- Win probability
- Timing
- Deal size
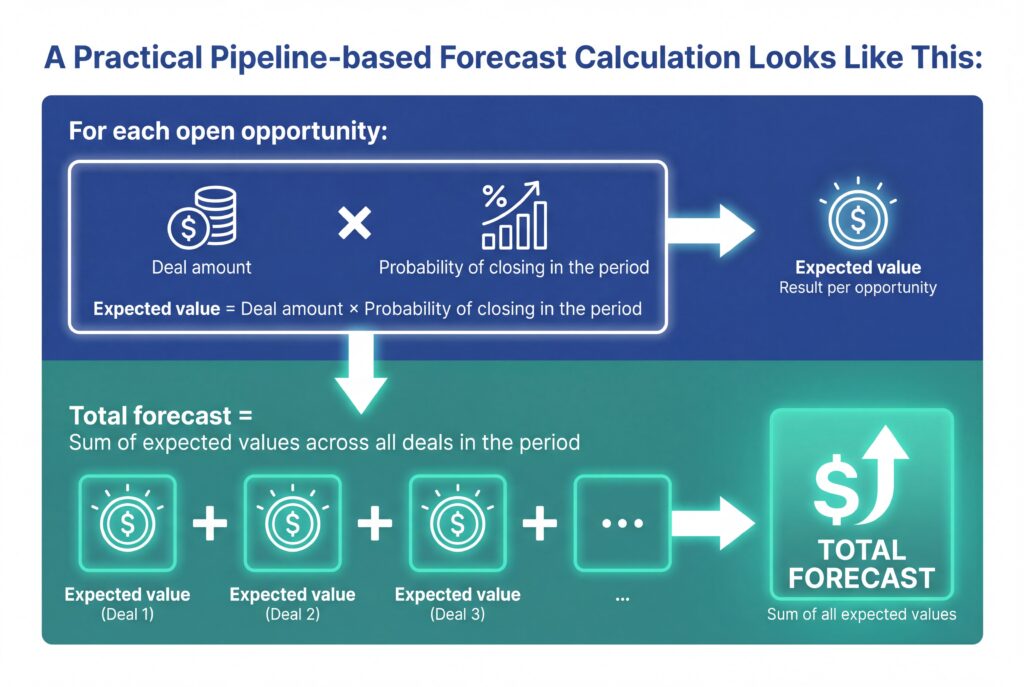
The trick is that probability should not be a default CRM field. It should come from your actual conversion rates by stage and segment.
Then add recurring revenue logic if you sell subscriptions:
Forecasted revenue = New revenue + Renewals + Expansion − Churn impact
Step 3: Pressure-test before you publish the number
Forecasts should feel a little uncomfortable. If they feel smooth, you probably hid risk.
Pressure-test with three checks:
Check 1: Coverage sanity
Pipeline coverage ratio = Weighted pipeline ÷ Target
If your coverage is consistently way above what you historically need, your probabilities are inflated. If it is consistently below, you either have a pipeline problem or you are under-weighting.
Check 2: Timing sanity
Compare expected close dates to your historical cycle times.
If a deal is forecasted to close in 2 weeks but your median cycle is 90 days, it needs a hard look.
Check 3: Deal evidence sanity
Ask for evidence behind the confidence:
- What changed since last week?
- What buyer action proves momentum?
- What is the next step and date?
- Who is the decision owner and who can block?
If you cannot point to evidence, it is not commit.
Step 4: Create a forecast you can operate
Break forecasts into views:
- By segment (SMB, mid-market, enterprise)
- By motion (new logo, expansion, renewal)
- By stage group (early, mid, late)
- By rep and manager rollup
You want to see where risk lives without doing mental gymnastics.
Adjust the forecast for reality (without breaking trust)
Seasonality adjustments
If your history shows clear peaks and troughs, build a seasonal index.
Example approach:
- Compare each month or quarter to the annual average
- Apply that factor to baseline forecasts
If Q4 is consistently 20% above average because budgets get spent, treat it as a known shift. Make it explicit.
Market & product changes
Some changes are structural – pricing changes, product launches, competitive disruption.
Do not “bake it in” quietly.
Call it out:
- “This forecast assumes win rates drop 3 points in Segment A due to competitor pricing.”
- “This forecast assumes average deal size rises 10% due to new packaging tier.”
Your stakeholders do not need certainty. They need a clear line from assumption to number.
Rolling forecasts beat static ones
A rolling forecast recalculates as new data arrives. Weekly or monthly.
Static forecasts decay the moment reality changes.
If your market moves fast, your forecast cadence needs to match it.
Forecast Review Cadence & Governance
This is where forecasting becomes operational.
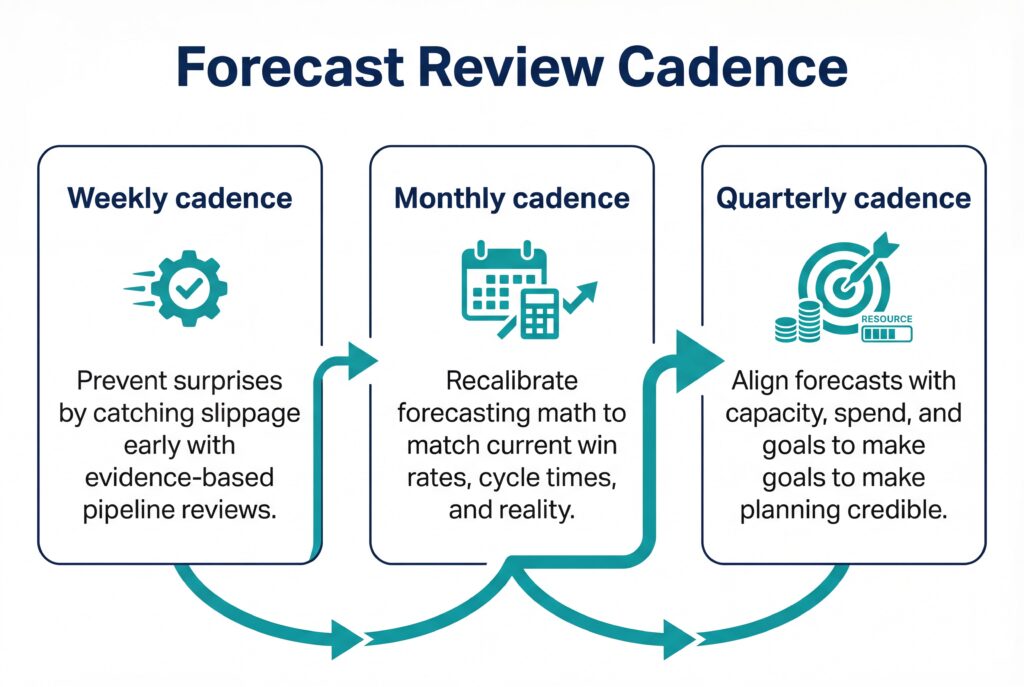
Weekly pipeline & forecast reviews
Weekly is the minimum for most B2B orgs.
The goal is not to interrogate reps. It is to prevent slippage from becoming a surprise.
A solid weekly review structure:
- 10 minutes: pipeline hygiene exceptions (stale next steps, outdated close dates)
- 20 minutes: top risks (big deals, slipped deals, stage stagnation)
- 20 minutes: commits and changes since last week
- 10 minutes: actions and owners
Keep it evidence-based.
A question that works better than “Are you sure?” is “What evidence supports that close date?”
That single shift changes the tone. It turns forecasting into coaching.
Monthly recalibration
Monthly is where RevOps should update model assumptions:
- Recalculate win rates by stage and segment
- Recalculate cycle time medians
- Adjust probability weights if reality shifted
This is how forecasting maturity compounds.
Quarterly planning alignment
Quarter starts are where forecasts tie into capacity, spend, and goals.
If your forecast is consistently missing by a wide margin, quarterly planning becomes theater.
Fix the system, not the story.
Measure forecast accuracy like a performance system
Forecasting gets better when accuracy is tracked and owned.
Core accuracy metrics
Forecast variance (accuracy)
- Variance = (Actual − Forecast) ÷ Actual
Track it by period. Then by segment. Then by manager rollup.
Pipeline coverage ratio
- Coverage = Weighted pipeline ÷ Target
Coverage is an early warning. If it is drifting, your model or your pipeline is drifting.
Win rates by stage
Recalculate regularly. If stage conversion changes, your probabilities are stale.
Sales cycle length by stage
Cycle creep is real. If deals are taking longer in mid-stage, you will miss timing even if you win.
What “good” looks like depends on maturity
Early-stage orgs with evolving process will have wider variance. That is fine.
What matters is whether variance improves as the system hardens.
A forecast is not “good” because it is close once.
It is good when it becomes consistently close.
Sales forecasting when you have limited/no history
Startups and new GTM motions often do not have enough clean history for robust models.
You still need to forecast.
You just need to be honest about what it is.
Use benchmarks as scaffolding, not truth
Industry benchmarks can help you set initial assumptions:
- Typical conversion rates
- Typical cycle length
- Typical pipeline coverage
Use conservative assumptions.
Then replace them quickly as your own data arrives.
Reverse-engineer from activity when revenue data is thin
If you are still building pipeline, focus on leading indicators that correlate with bookings:
- Demos booked per week
- Qualified opportunities created
- Proposal volume
- Stage progression rates
This is still predicting sales. Just earlier in the chain.
Common mistakes to avoid
- Ignoring churn or assuming all new accounts stick
- Using founder optimism as probability
- Never recalibrating after the first few months
Treat your initial forecast as hypothesis.
Then earn your way into confidence.
Improving sales forecast accuracy long term
Forecasting is a capability. You build it.
Reduce bias with definitions & proof
Define commit and best case with evidence-based rules.
Then enforce them.
Example commit criteria:
- Decision process confirmed
- Economic buyer engaged
- Mutual action plan with dates
- No unresolved deal blockers
If those are not true, it is not commit. Even if the rep wants it to be.
Track rep-level accuracy without turning it into a weapon
Forecast accuracy by rep can surface coaching needs:
- Chronic over-committers
- Chronic sandbaggers
- Deals that slip in the same stage repeatedly
Use signal-driven checks to catch risk early
The best forecasts do not rely on opinions alone.
They rely on observable behavior.
Examples of signals that should change forecast confidence:
- No next step scheduled
- Stakeholder engagement dropped
- Stage stagnation beyond historical norms
- Close date moved more than once
When you design forecasting around signals, you stop being surprised.
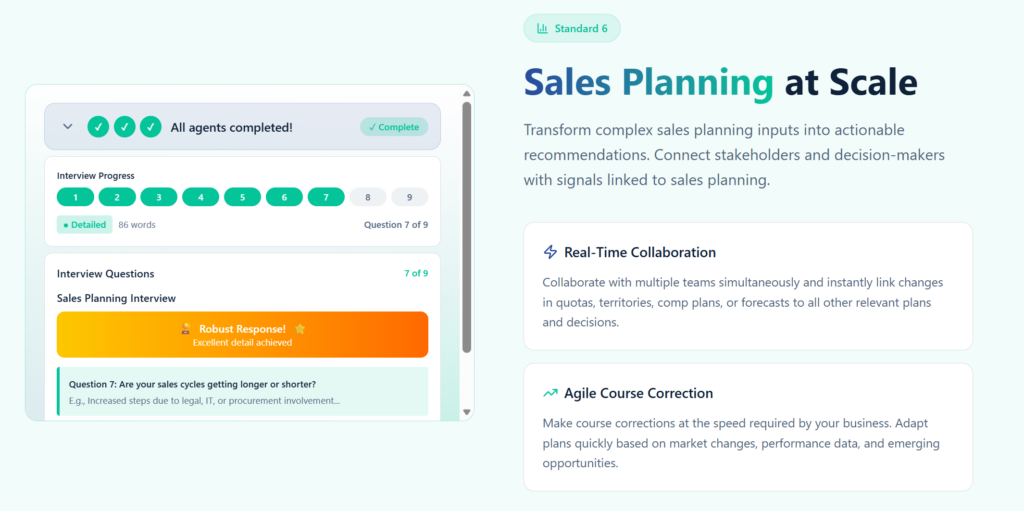
How EnableU Helps
Sales forecasting is only useful when it’s connected to planning decisions.
EnableU’s Sales Excellence turns forecasting inputs into coordinated strategy:
- Quotas, territories, comp plans, and forecasts stay linked
- Leaders collaborate in real time around shared planning signals
- Plans adapt as markets, performance, and assumptions change
Forecasts inform strategy.
Strategy stays executable as conditions change.
👉 Get a free demo to see Sales Planning in action.
Frequently Asked Questions
What are the different types of sales forecasting used by revenue teams?
The main types of sales forecasting include pipeline-based forecasts, historical trend forecasts, and driver-based models that factor in win rates, deal size, and sales cycle length. Most mature teams combine multiple types to balance accuracy and realism.
What is the best sales forecasting methodology for B2B companies?
There is no single best sales forecasting methodology. B2B teams typically use a hybrid approach that blends weighted pipeline forecasts with historical conversion data and commit-based judgment from managers.
How accurate should sales forecasts realistically be?
Sales forecasts are rarely perfect, but high-performing teams aim to consistently land within 5–10% of actuals. Improving accuracy over time matters more than hitting the number once.
How do you predict sales growth without overestimating revenue?
Predicting sales growth requires separating net growth from gross bookings. That means factoring in churn, expansion, and sales cycle changes instead of assuming new pipeline automatically converts.
Conclusion
Sales forecasting is ultimately about decision quality. Not the model you pick, but how consistently your assumptions hold up once deals move, plans shift, and reality shows up.
The strongest teams treat forecasting as an ongoing discipline. Stage definitions are enforced. Data stays current. Signals are reviewed early enough to change outcomes. That’s how sales forecasting methods stop being academic and start shaping hiring, spend, and priorities with confidence.
When forecasting, planning, and execution stay aligned, leaders spend less time explaining variance and more time steering the business forward.
If you want to see how this discipline works in practice, start a free trial of EnableU. It turns your forecasting inputs into live planning signals, so quotas, territories, and course corrections stay connected as conditions change.